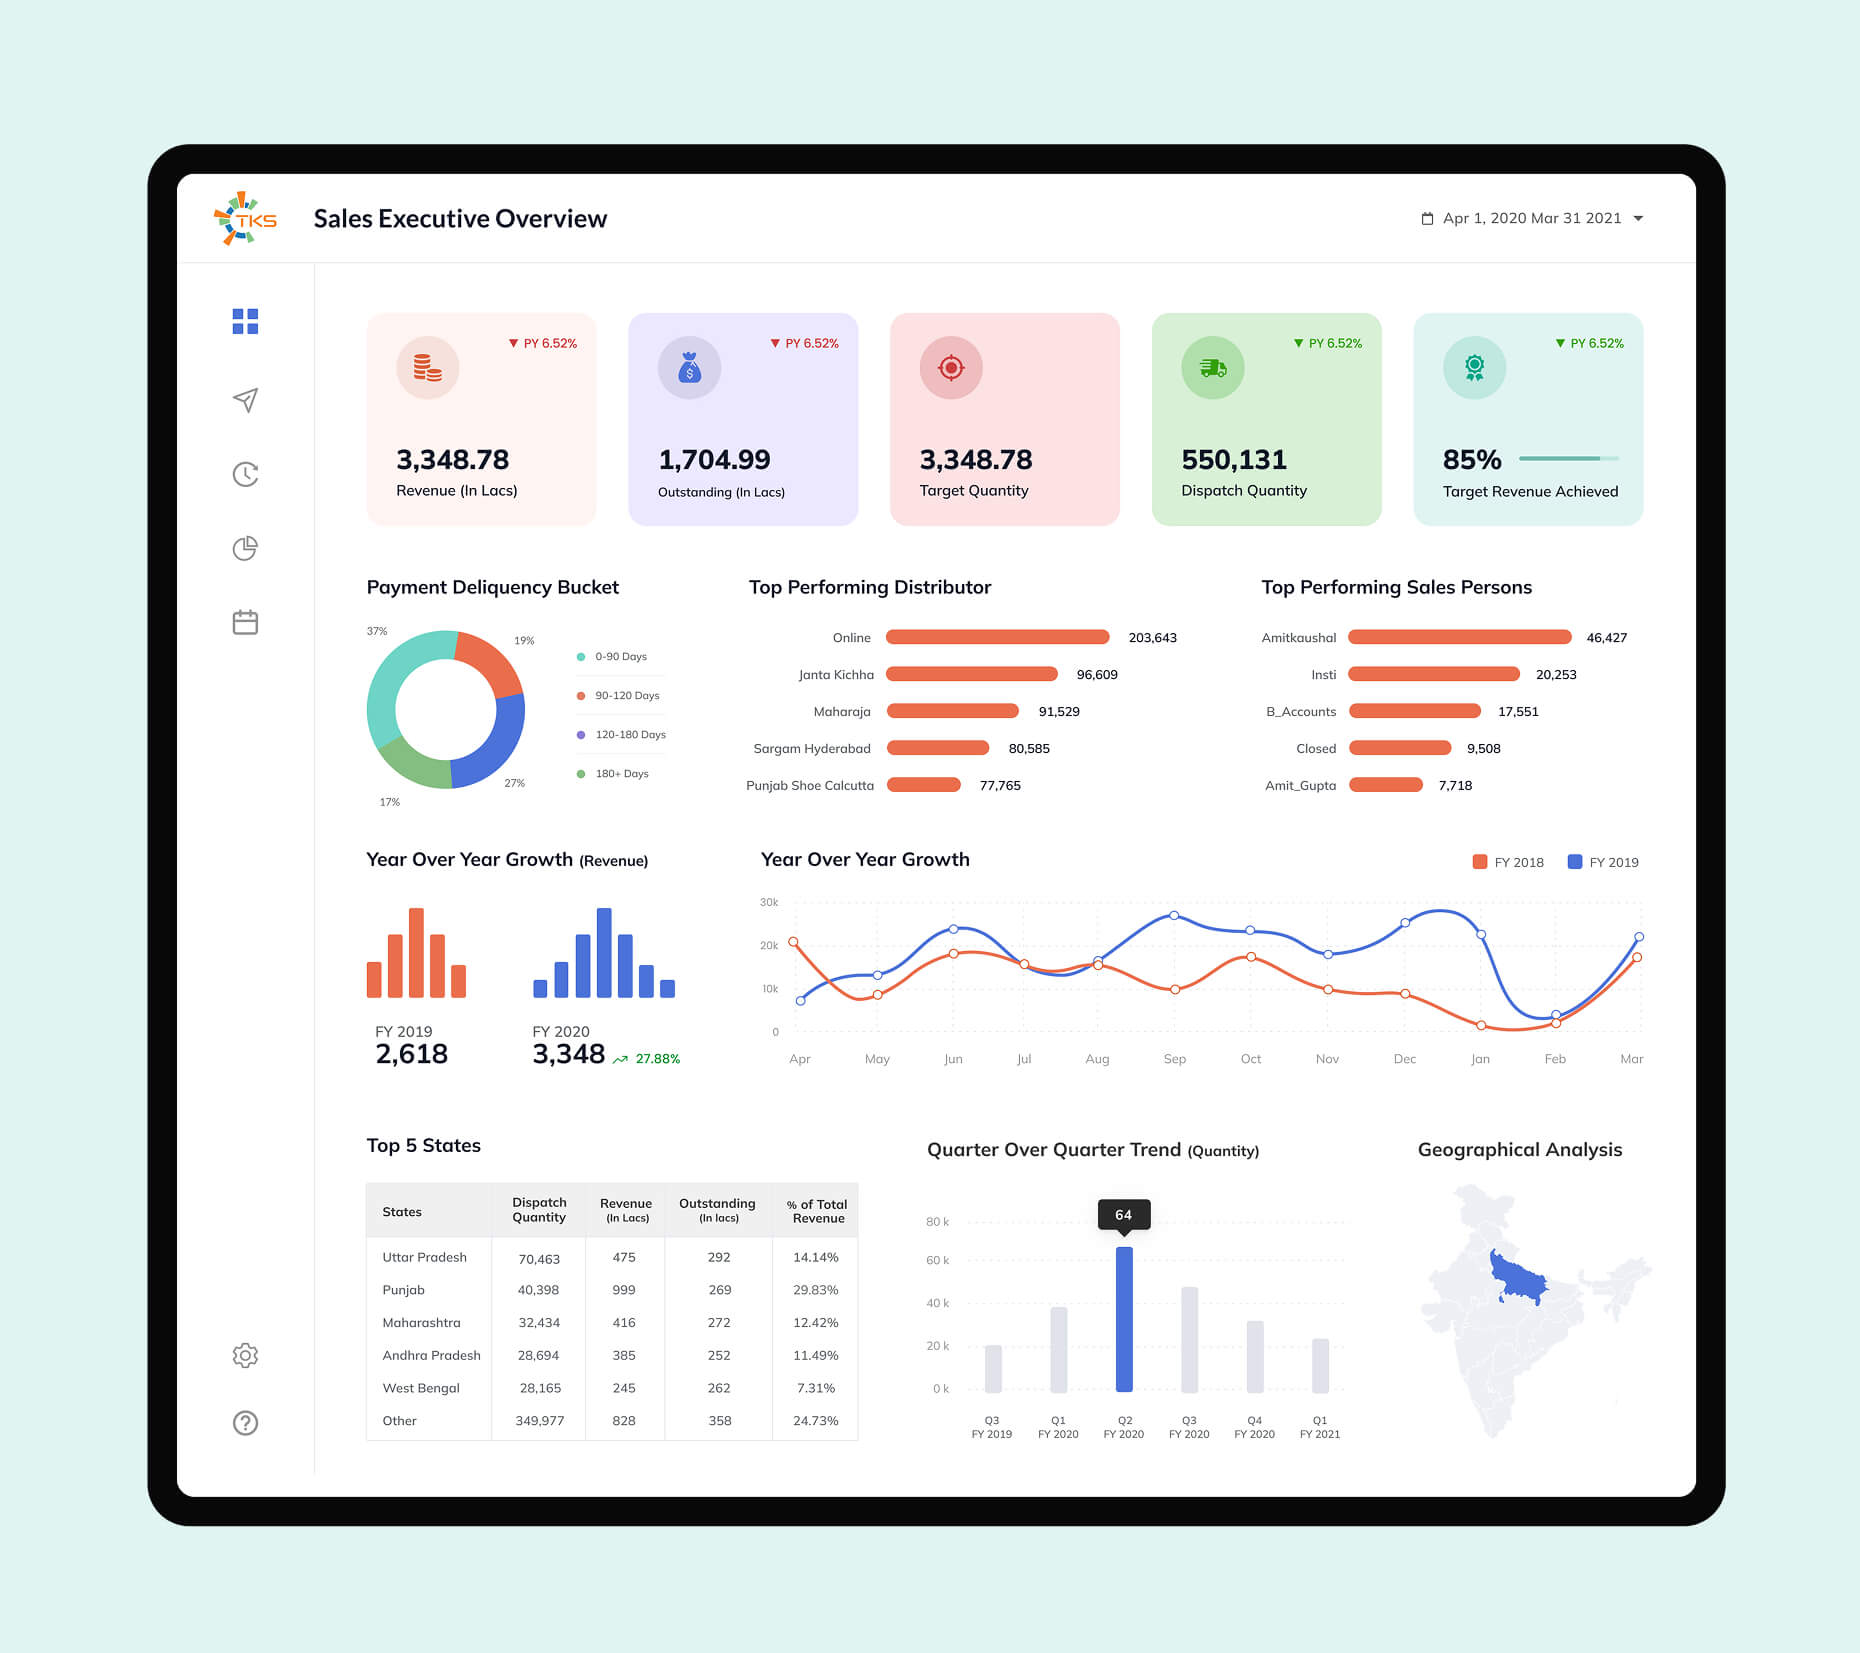
Sales Dashboard

About The Project

ScatterPie, a leading Data Analytics Consulting company, is engaged in developing visualization tools that extract actionable insights from clients’ data. As part of their Business Intelligence solutions suite, the company engaged us to create a Sales Dashboard.


Solutions

Using best design practices and frameworks, we created a powerful dashboard that helps sales executives quickly summarize sales performance. Loaded with several user-friendly features, the dashboard serves as a powerful tool for sales teams to speedily analyze data and gain actionable insights for future work.


Donut Chart

Donut Chart defines the percentage of customers who delayed their payment between different time intervals shown in legends

Bar Chart

Bar Chart Defines the top performing Distributor by Sales in descending Order

Line Chart

Line chart defines the growth of the sales in respective years 2018 & 2019

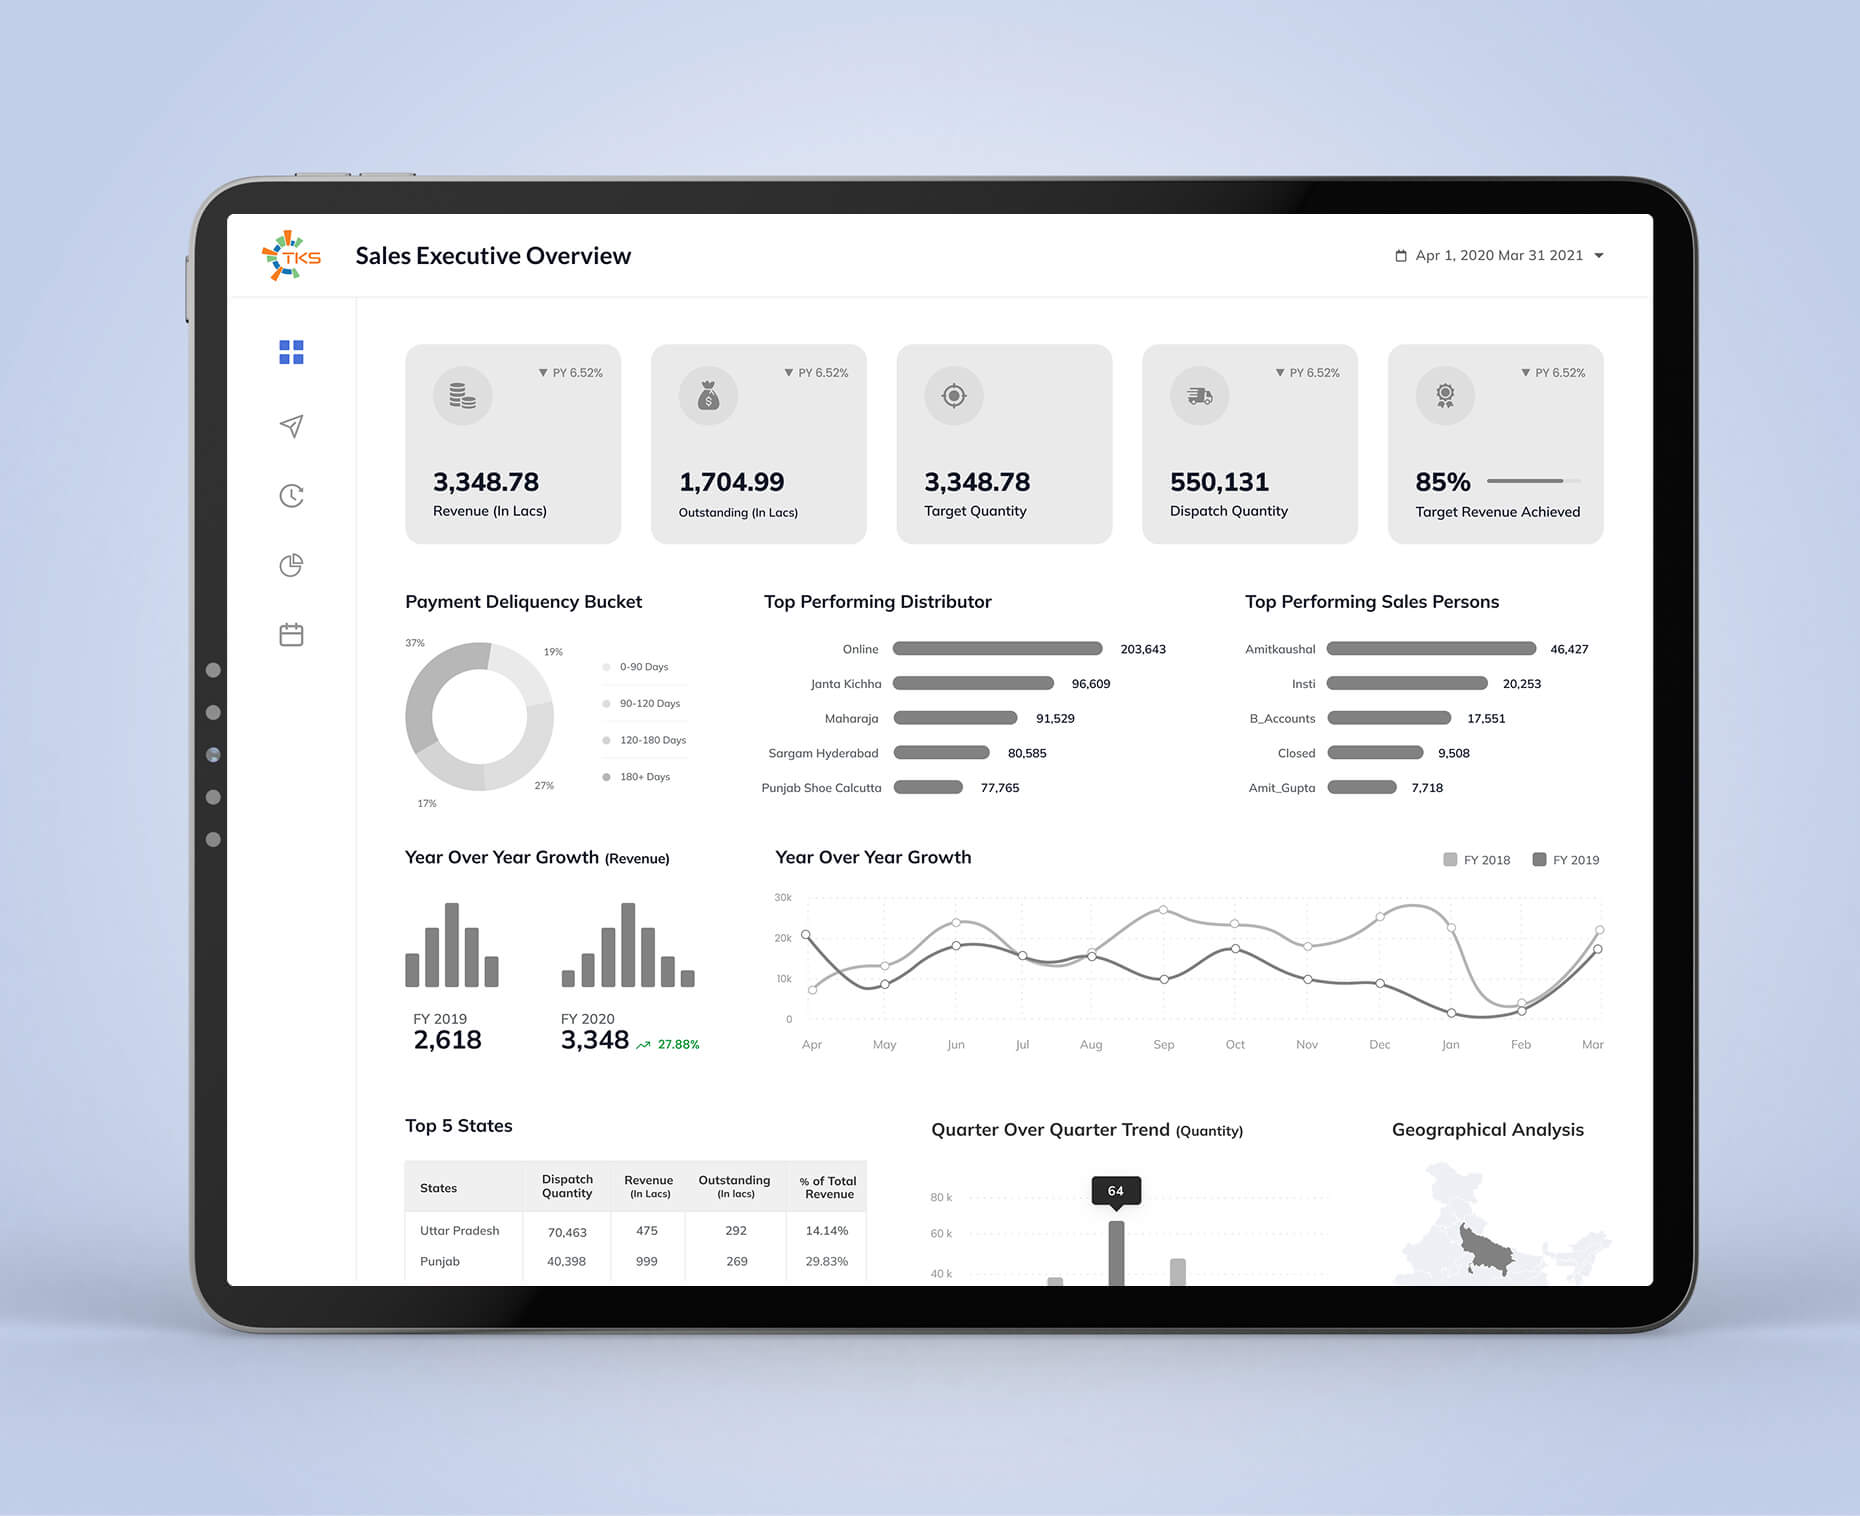
Low fidility Wireframe

Style Guide

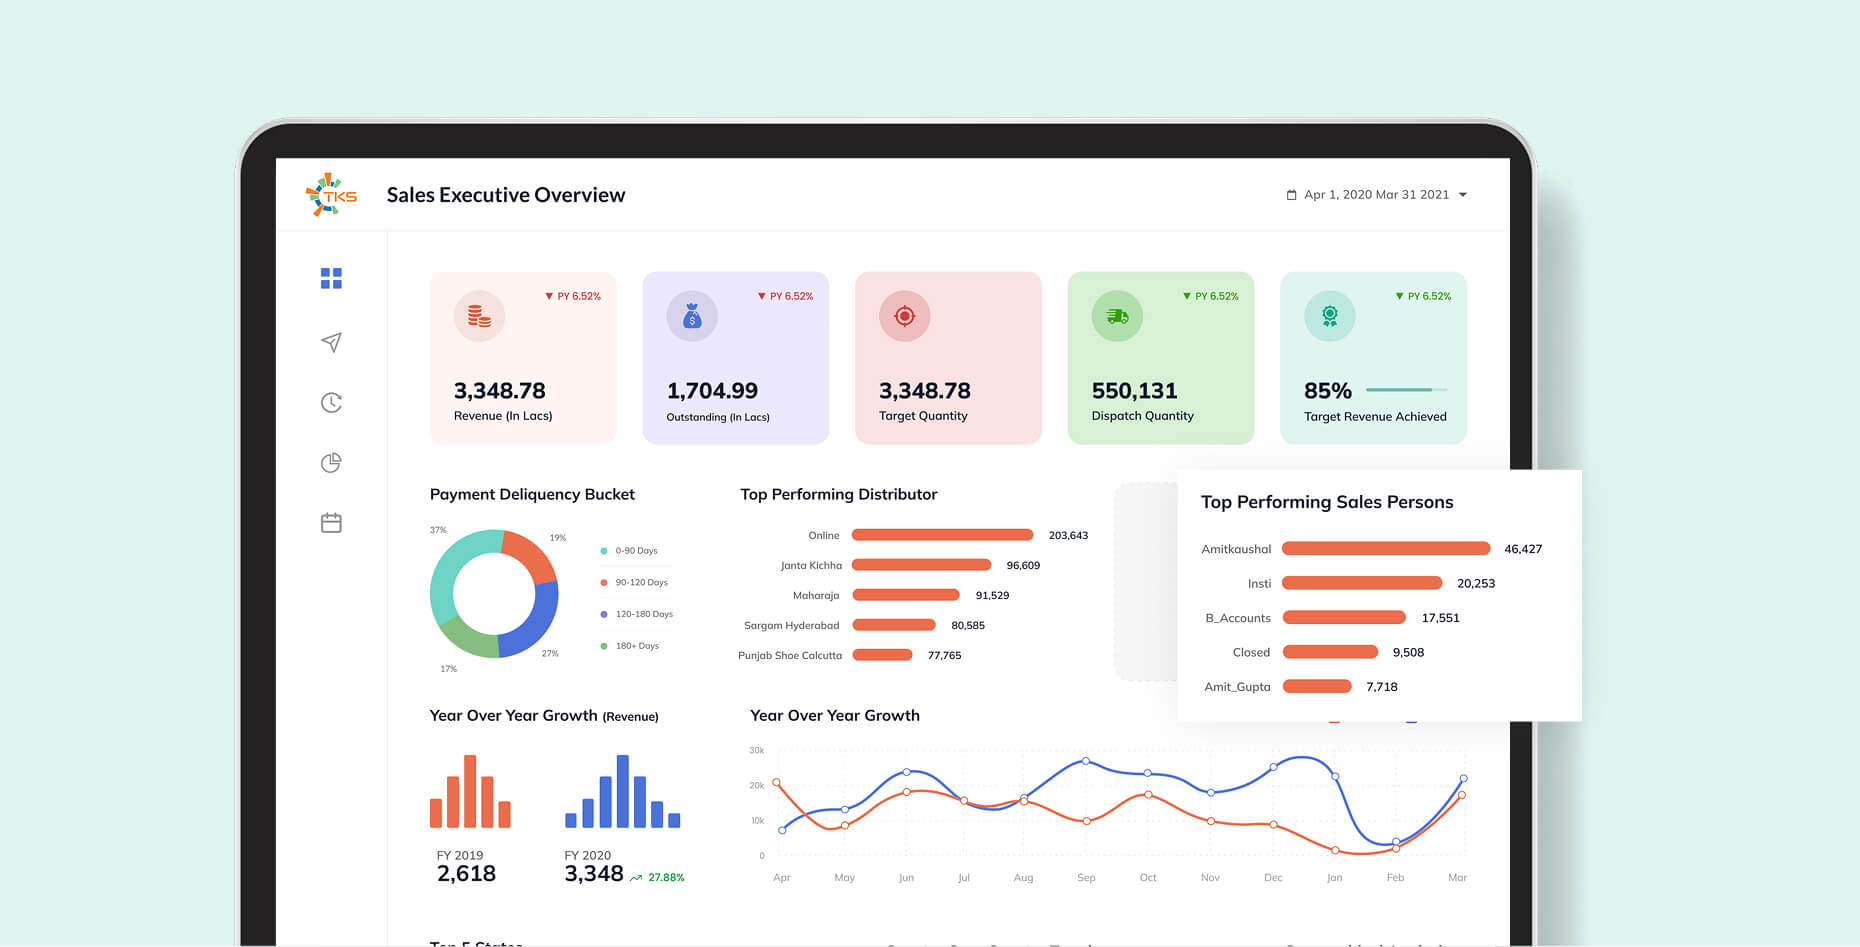
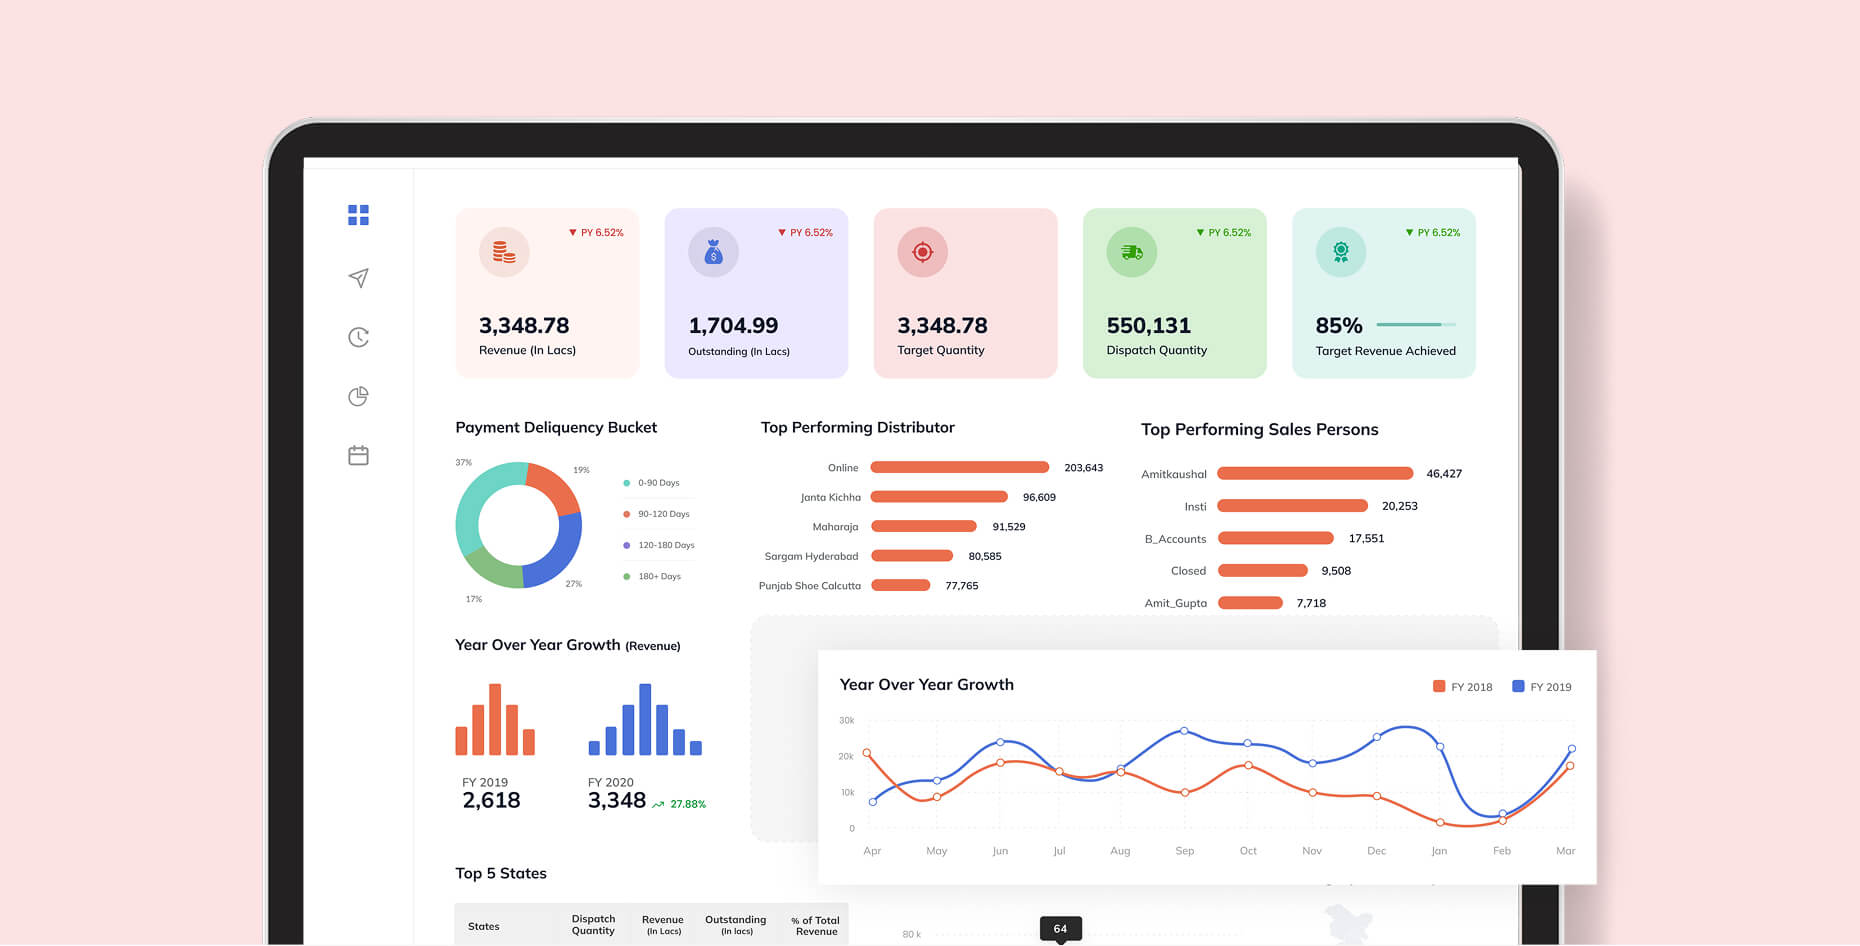
High-Fidelity Wireframe